“Visualization answers the questions you didn’t know you had.” The quote of Ben Shneiderman, a pioneer in the field of human-computer interaction, describes the potential of transforming raw data into a visual masterpiece. We at SUM Group, we specialize in using MATLAB’s cutting-edge visual tools to generate dynamic 3D models as well as insights for cutting-edge research and engineering projects. From complex simulations to amazing images, our experience makes data available, but also unforgettable.
Why 3D Visualization Matters
Data isn’t just a series of numbers on the screen. It’s an entire story that’s ready to tell. In many industries the story is told through three-dimensional. When you’re creating an aerodynamic wing, studying geological structures, or analyzing molecular dynamics 3D Modeling can provide the clarity and precision that graphs on paper cannot provide.
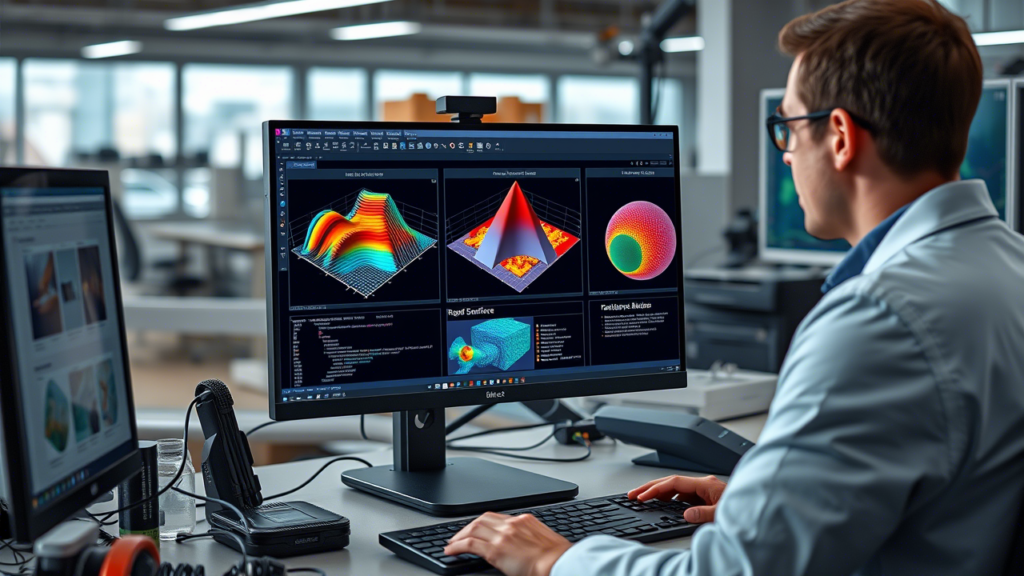
This is the area where MATLAB excels. By using functions such as mesh contour, isosurface, and mesh it is possible to transform your raw equations data, measurements, and other datasets into captivating 3D visualizations. With the expertise of SUM Group the tools can be efficient solutions that can be specifically tailored to your particular needs.
The Big Hitters include mesh, contour and isosurface
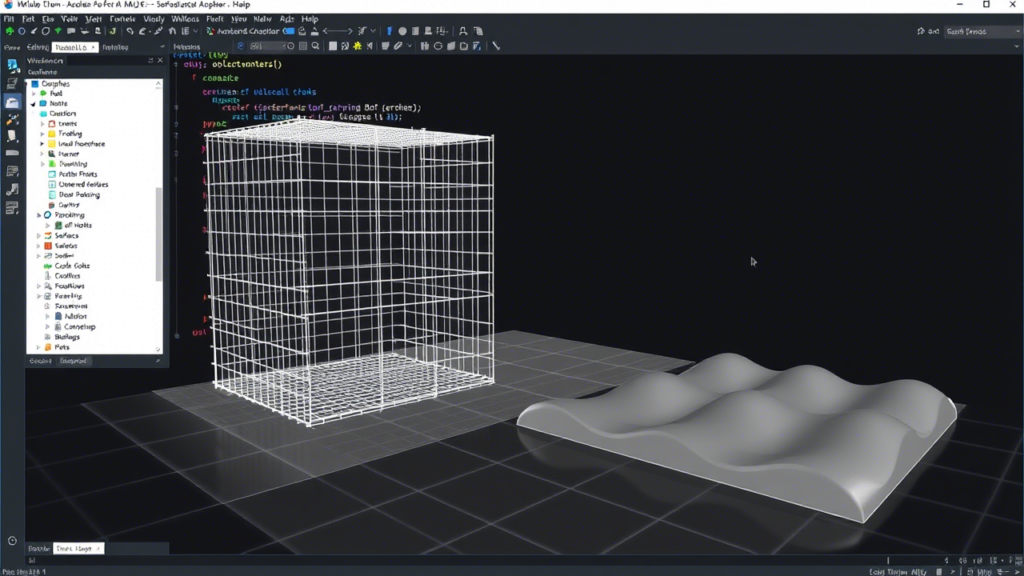
1. mesh: It is the Backbone of Surface Visualization
Imagine mesh as your primary tool to create surface plots. The function makes use of an array of points to create wireframes of your data. This makes it the ideal tool to visualize temperatures, topography, or any other data that changes across two dimensions.
A case study in action An engineering company we collaborated with was looking to understand the stress distribution in a prototype. Using mesh, we produced an elaborate surface map highlighting the areas of concern, assisting the design team to refine their ideas before costly physical tests.
2. Contour: Brings the Hidden Layers to the Light
Contour graphs serve as the visual map makers of data visualization. Through cutting through 3D data at various levels contours show boundaries and patterns that could otherwise be overlooked. It’s similar to peeling back onion layers, but with greater precision.
Real-world application Geophysics teams are needed to evaluate subsurface structures in mineral exploration. Using contours, we developed layers of visualizations that highlighted possible drilling locations, saving them time and money.
3. isosurface: Sculpting 3D shapes from Data
If you have to visualize and extract particular volumes of 3D data, isosurface is the tool you should use. It creates strong, slender 3D forms representing areas that meet certain requirements, which is ideal in fluid dynamics, medical imaging or even material science.
Breakthrough Example: In a medical research project, we utilized isosurface to simulate the growth of tumors using MRI data. The result? A clearly interactive 3D image that allowed doctors to comprehend the effects of treatment over time better.
How SUM Group Delivers Custom 3D Solutions
Making powerful 3D visualizations isn’t just about learning MATLAB’s tools; it’s about knowing your objectives and adjusting solutions to meet those. Here’s how we accomplish it:
1. Listening First, Building Second
Every project begins with a discussion. What’s your problem? What are you looking for? If we understand your requirements, we can create visualizations that do more than appear great, but provide value.
2. From Data to Dimensions
Utilizing the data that we have gathered, we use the power of mesh, contour and isosurface to build models that transform numbers into images. It doesn’t matter if it’s simulating flow through a pipeline or modelling the terrain of a newly-mapped region; we help make the difficult understandable.
3. Interactivity is Key
Why choose static images? Our custom solutions typically contain interactive dashboards and GUIs that allow users to zoom, rotate, and even manipulate 3D models in real time. This makes presentations more enjoyable but also lets you better understand data.
4. Testing and Refinement
We believe in repetition. After the first models have been developed, we evaluate the models for clarity as well as accuracy and usability. Feedback isn’t only appreciated, it’s crucial. This helps ensure you that final products is in line with expectations.
Industries We’ve Helped Transform
1. Aerospace and Defense
From simulations of airflow to trajectory modeling Our 3D tools have assisted engineers improve their designs and ensure safety before production starts.
2. Healthcare and Biomedical Research
Our work on isosurfaces has resulted in breakthroughs in imaging from visualizing organ structures, to modeling the behavior of cells.
3. Environmental Sciences
Mesh tools and contours enable us to map the patterns of climate as well as model erosion and examine pollution dispersion with astonishing accuracy.
Why Choose SUM Group for 3D Modeling?
- Expertise that Matters We’re not only experts on the basics of MATLAB, but we’ve learned its tricks and ensure you get the highest quality results each time.
- Customized Solutions: Every project is different and so are our methods. We can customize techniques and tools to meet your requirements.
- Collaborative approach Our input guides our processes. We believe that the best solutions are based on teamwork.
- Results You can Trust Reliability and accuracy are the foundation of all we do.
The Bottom Line
When design and data meet and innovation takes place. With the help of MATLAB’s 3D tools such as mesh, contour and isosurface, and SUM Group’s data transformation experience, your data becomes an effective storytelling tool. When you’re tackling complicated engineering issues or conducting cutting-edge research, we’re here to help transform your idea into reality.
Are you ready to enhance your work by using stunning 3D visualizations? Contact SUM Group today, and we’ll transform your data into gorgeous interactive models that generate the results!